Two community-built PowerShell tools that automate Azure topology diagrams and governance reporting—no more manual Visio diagrams or hunting through the portal.
| Date | Category |
|---|---|
| 2025-12-17 | Documentation |
If you’ve ever inherited an Azure environment with little to no documentation, you know the pain. You’re left piecing together the architecture by clicking through the portal, manually drawing diagrams in Visio or LucidChart, and hunting down policies, RBAC assignments, and PIM roles across subscriptions. (And we both know “I’ll document it when I’m done” is a lie you tell yourself.) It’s tedious, error-prone, and the documentation you create is outdated the moment someone makes a change.
Fortunately, there are two excellent community tools that automate this:
- AzViz — Generates visual topology diagrams of your Azure resources
- AzGovViz — Produces comprehensive governance reports covering RBAC, policies, and management hierarchy
Let’s dive into both.
1. AzViz (Topology Diagrams)
Author: Prateek Kumar Singh
Repository: github.com/PrateekKumarSingh/AzViz
What is it? AzViz (Azure Visualizer) is a PowerShell module that automatically identifies resources and their dependencies to generate rich infrastructure diagrams in PNG or SVG format.
Why use it?
- Zero-Touch Diagrams: No need to drag-and-drop icons in Visio. AzViz reads the live environment.
- Dependency Mapping: It automatically detects links between resources (e.g., NICs → Subnets → VNets).
- Customization: Supports themes (Light, Dark, Neon) and custom categorization depths.
Prerequisites
AzViz requires Graphviz to be installed on your machine to render the diagrams:
# Install via Chocolatey
choco install graphviz

# Or via Winget
winget install graphviz
Install and Import Module
Install-Module -Name AzViz -Scope CurrentUser -Repository PSGallery -Force

Import-Module AzViz
Usage
Connect to Azure first (Connect-AzAccount), then run:
# Basic Visualization of a Resource Group
Export-AzViz -ResourceGroup "rg-demo-app-001" -Theme light -OutputFormat png -Show

# Increased Depth (Show Sub-resources)
Export-AzViz -ResourceGroup "rg-demo-app-001" -CategoryDepth 2 -Theme light -OutputFormat png -Show

# Multiple Resource Groups
Export-AzViz -ResourceGroup "rg-app-01", "rg-net-01" -LabelVerbosity 1 -CategoryDepth 1 -Theme light -OutputFormat png
Example Output
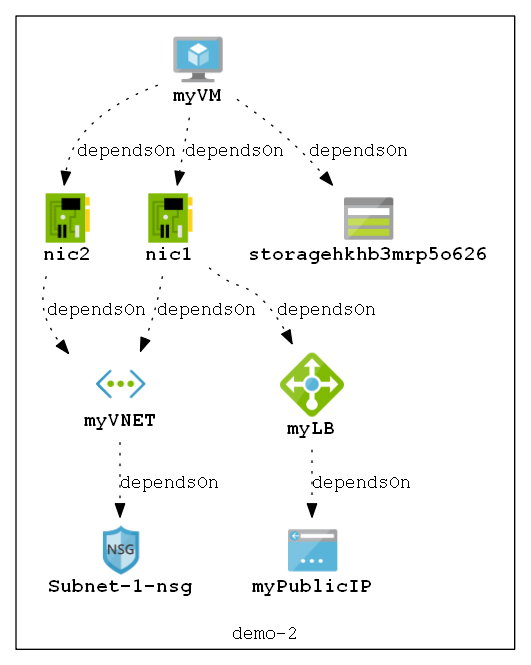 A single resource group visualized with AzViz showing resource dependencies.
2. AzGovViz (Governance Reporting)
Author: Julian Hayward
Repository: github.com/JulianHayward/Azure-MG-Sub-Governance-Reporting
What is it? AzGovViz (Azure Governance Visualizer) is a comprehensive auditing script that documents your entire management hierarchy—from Management Groups down to Subscriptions and Resource Groups.
Why use it?
- Holistic View: Captures Policy assignments, RBAC roles, and Blueprints across the entire tenant.
- Interactive Report: The output is an HTML file containing a color-coded matrix of your permissions and policies.
- Change Tracking: Run this periodically and commit the CSV/JSON outputs to Git to track governance drift over time.
- Orphan Detection: Identifies orphaned role assignments (e.g., users who have left the organization).
Prerequisites
- PowerShell 7 (pwsh)
- Az PowerShell Modules installed
- Appropriate permissions to read tenant-level governance data
Setup
- Clone the repository:
git clone https://github.com/JulianHayward/Azure-MG-Sub-Governance-Reporting.git - Prepare an output folder (e.g.,
C:\AzGovViz-Output)
Usage
Navigate to the script directory and run:
# Run against a Management Group (HTML Report Generation)
.\pwsh\AzGovVizParallel.ps1 -ManagementGroupId "mg-root" -OutputPath "C:\AzGovViz-Output"
Example Output
The output is an interactive HTML report containing a full matrix of your environment’s governance posture:
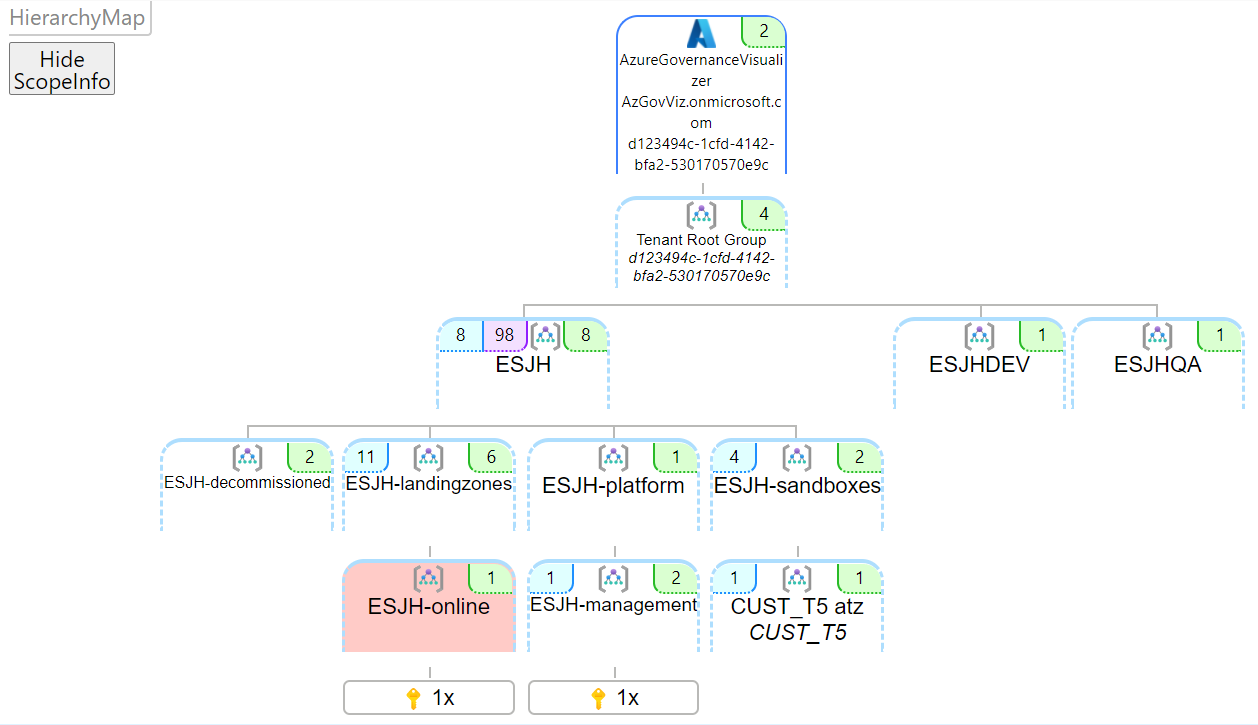 The hierarchy map showing your Management Group and Subscription structure.
 The summary page with an overview of policies, RBAC assignments, and more.
When to Use Each Tool
| Scenario | Use This Tool |
|---|---|
| Need a quick architecture diagram for documentation | AzViz |
| Onboarding to a new environment and need to understand resource layout | AzViz |
| Auditing RBAC and policy assignments across the tenant | AzGovViz |
| Tracking governance drift over time | AzGovViz |
| Preparing for a compliance review | AzGovViz |
| Creating visuals for stakeholder presentations | AzViz |
Final Thoughts
These two tools have saved me hours of manual documentation work. Instead of clicking through the portal and manually drawing diagrams, I can generate accurate, up-to-date visuals and reports with a single command. If you’re managing Azure environments—especially ones you’ve inherited—these tools belong in your toolkit.
A huge shoutout to Prateek Kumar Singh and Julian Hayward for building and maintaining these tools. There’s something genuinely beautiful about people putting their personal time and effort into creating something useful—then sharing it freely for the rest of us.